
Field worker
Kiln manager, yard supervisor, store keeper. Often limited reading, shared phones, weak network.
- Records daily activity by tap, voice or photo
- Hears every screen read aloud
- Sees one simple monthly result
High-level product documentation · v0.1
A multi-company app that turns what workers already know (sacks of coal, empty gas cylinders, meter readings) into a GHG inventory that managers, buyers and auditors can trust.
Who uses it
Each person sees only what they need. The person entering data never has to understand carbon; the person reading the report gets full scientific detail.
Kiln manager, yard supervisor, store keeper. Often limited reading, shared phones, weak network.
Sustainability lead or office manager at each company.
Owners, international brand buyers, banks, third-party verifiers.
How it works
Every entry passes through the same six stages, in this order. Scroll through them.
The worker records today's activity in whichever way is easiest: tap a number with big + and − buttons, say everything in one sentence, or photograph a receipt, meter or pile of cylinders. Entries save on the phone first, so no network is needed.
AI turns speech into items, reads numbers off receipts and meters, and counts objects in photos. It never saves on its own: it shows what it understood, reads it back aloud, and asks a two-choice question when unsure. The worker confirms.
Local units become standard ones using the conversions each company sets: sacks to kilograms, maunds to kilograms, cans to litres, meter readings to kWh used today. The original entry is kept beside the converted value.
Activity data is multiplied by a versioned emission factor and converted to CO₂e with global warming potentials. Each result is tagged with its scope, source category, ISO 14064-1 category and gas.
AI flags unusual values (coal use triple last week's, a meter going backwards). The admin sees each flag with its photo or voice evidence and approves or corrects it. Every change is logged for the audit trail.
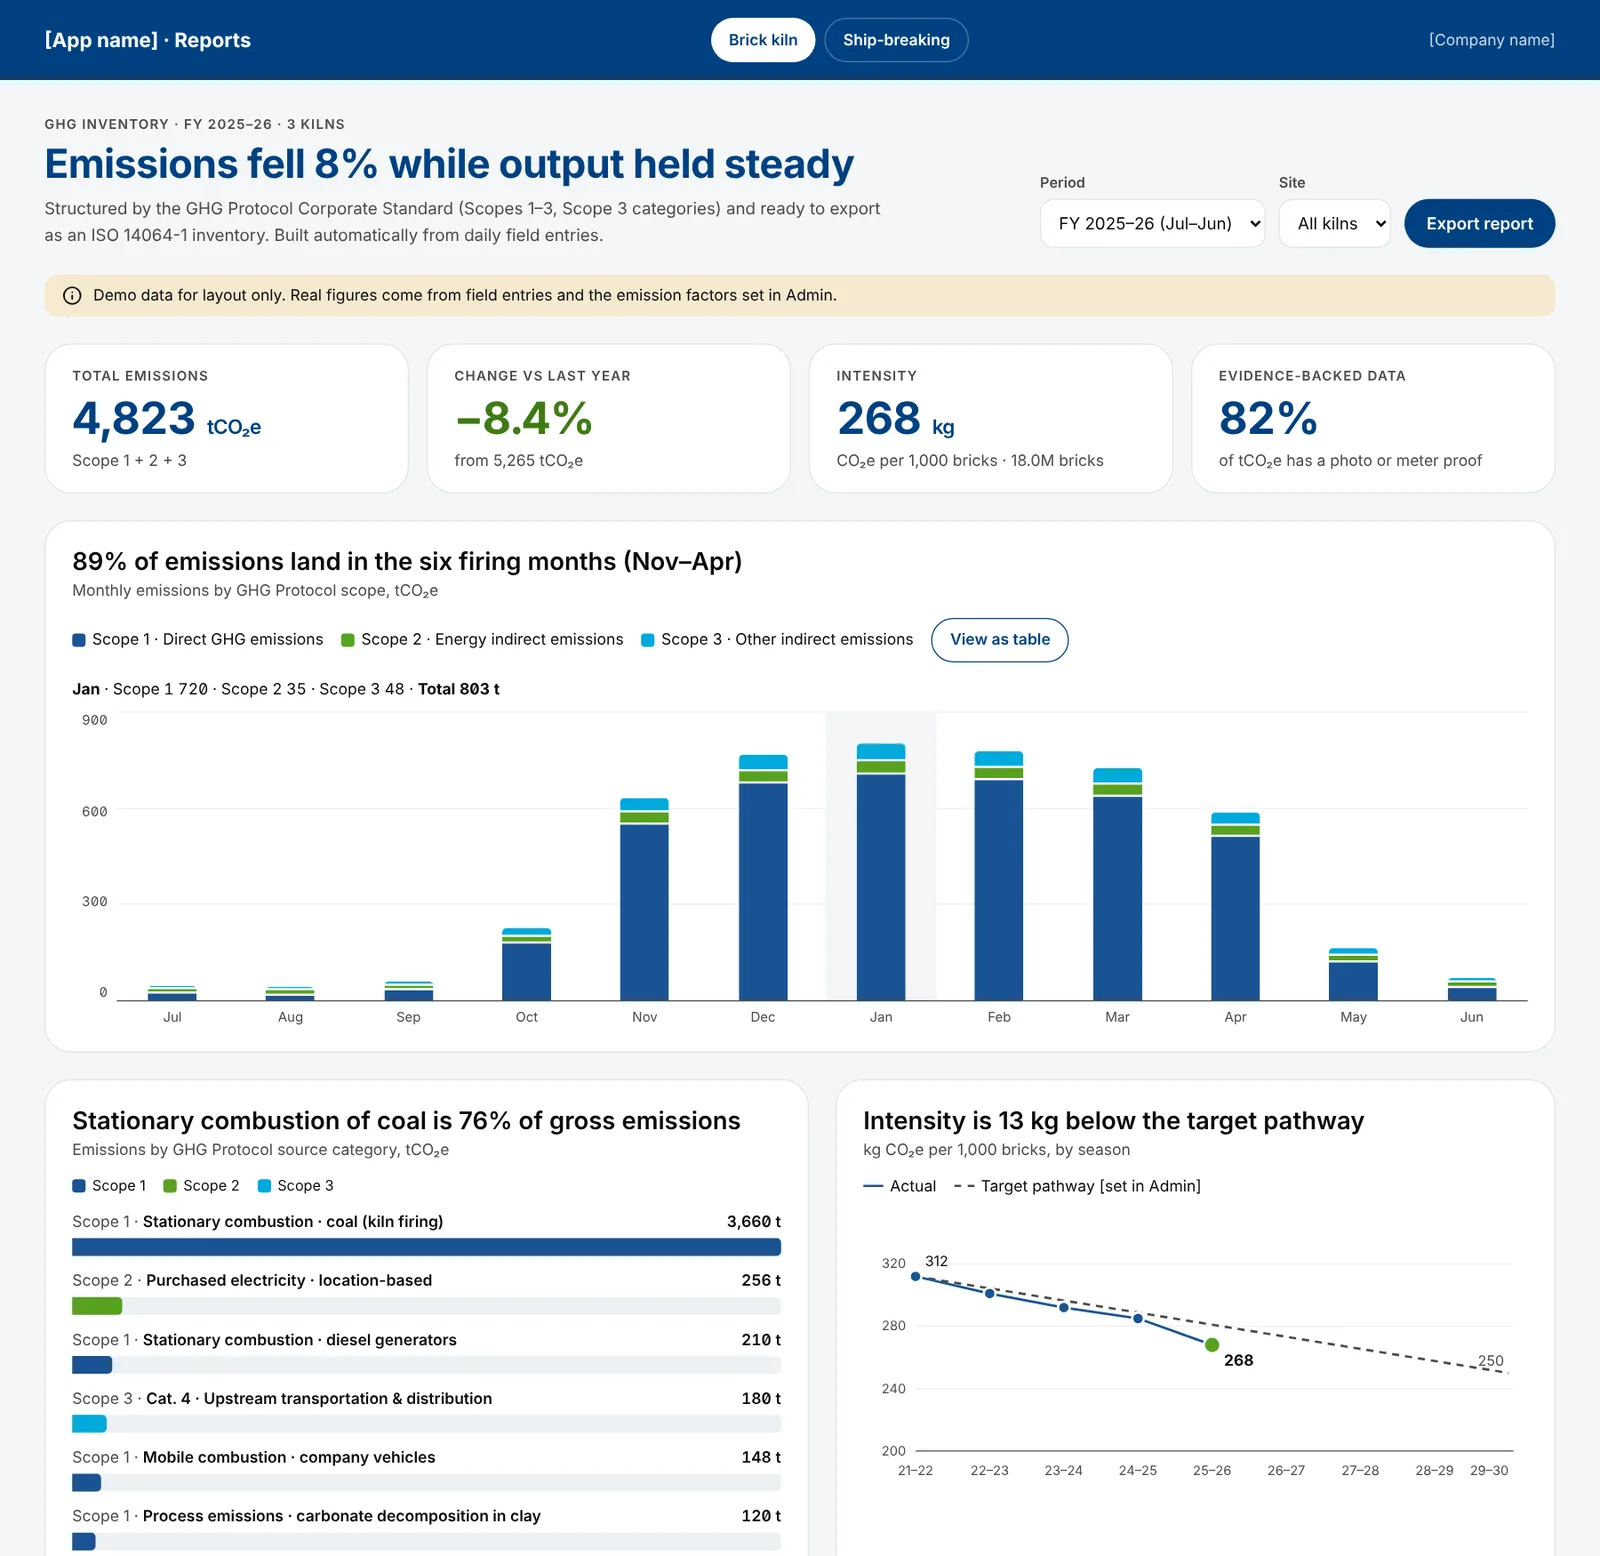
Approved data rolls up into two views: one plain result for workers (this month vs last month, in Bangla), and a full GHG inventory for management and auditors with scopes, categories, gases, intensity and evidence.
Demo · a morning at the kiln
A morning at a brick kiln, from opening the app to the monthly result.
Scroll to walk through one daily entry, screen by screen. The green ring shows where the worker taps next. Under each step: what the system does behind the scenes.
Six tiles, one per activity type at this kiln. Coal and bricks are already done today; the worker taps Coal to update it. Or uses one of the two big buttons to speak or photograph.
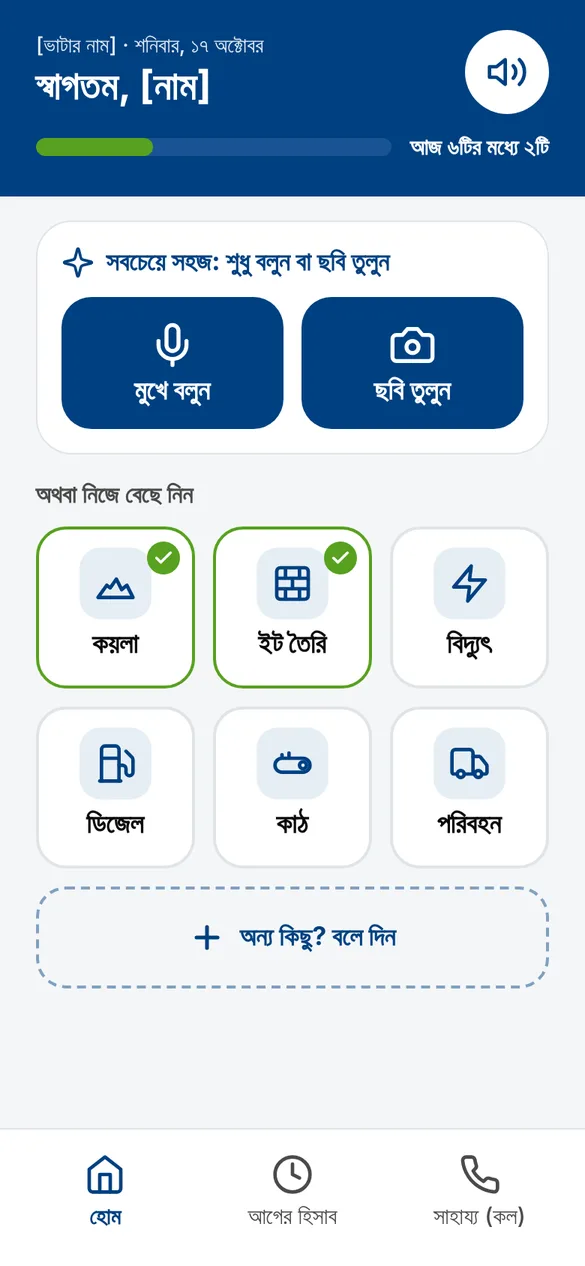
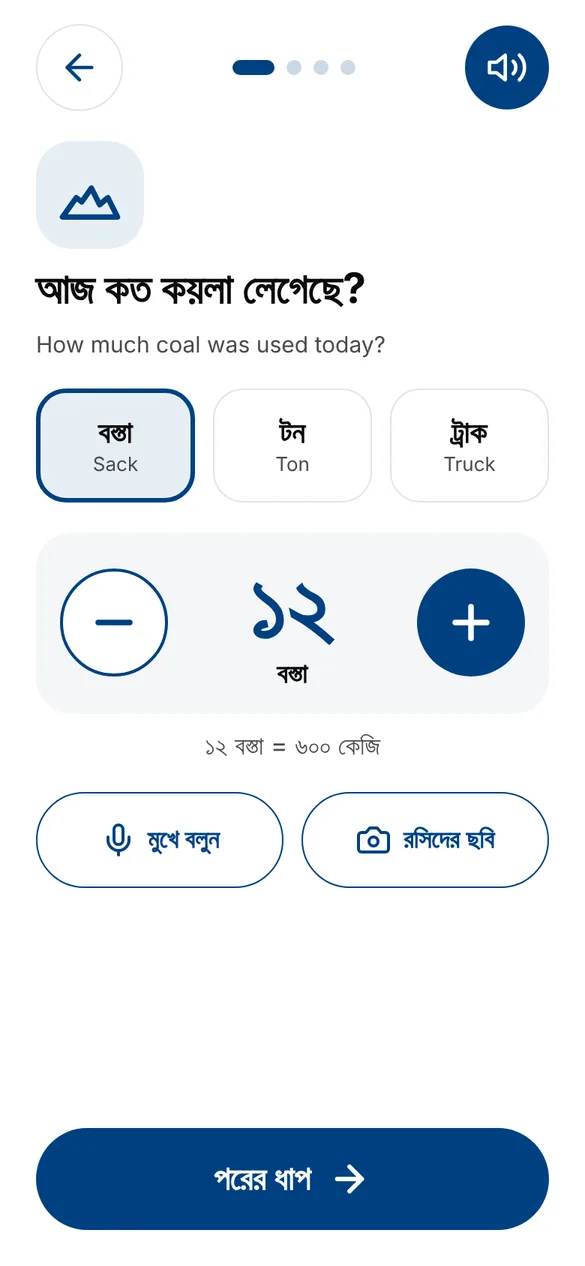
The question is one short Bangla sentence with a speaker button. The worker picks sacks as the unit and taps + until it says ১২, then taps Next.
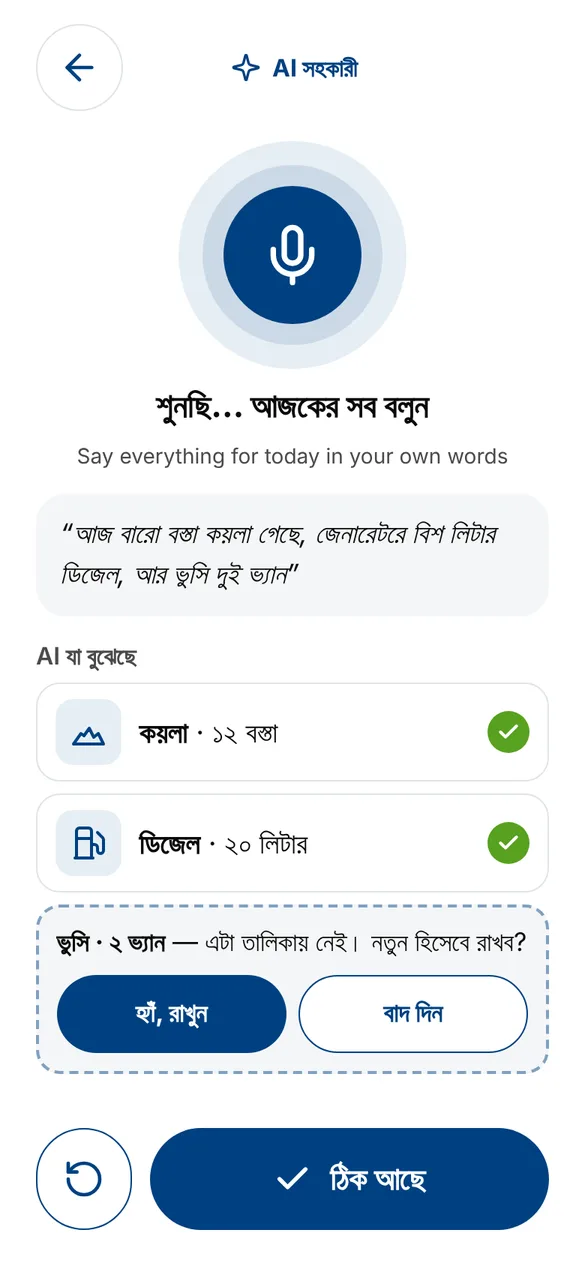
Instead of tapping each tile, the worker can speak: “twelve sacks of coal, twenty litres diesel for the generator, two vans of husk.” AI lists what it understood and asks about the item it doesn't know.
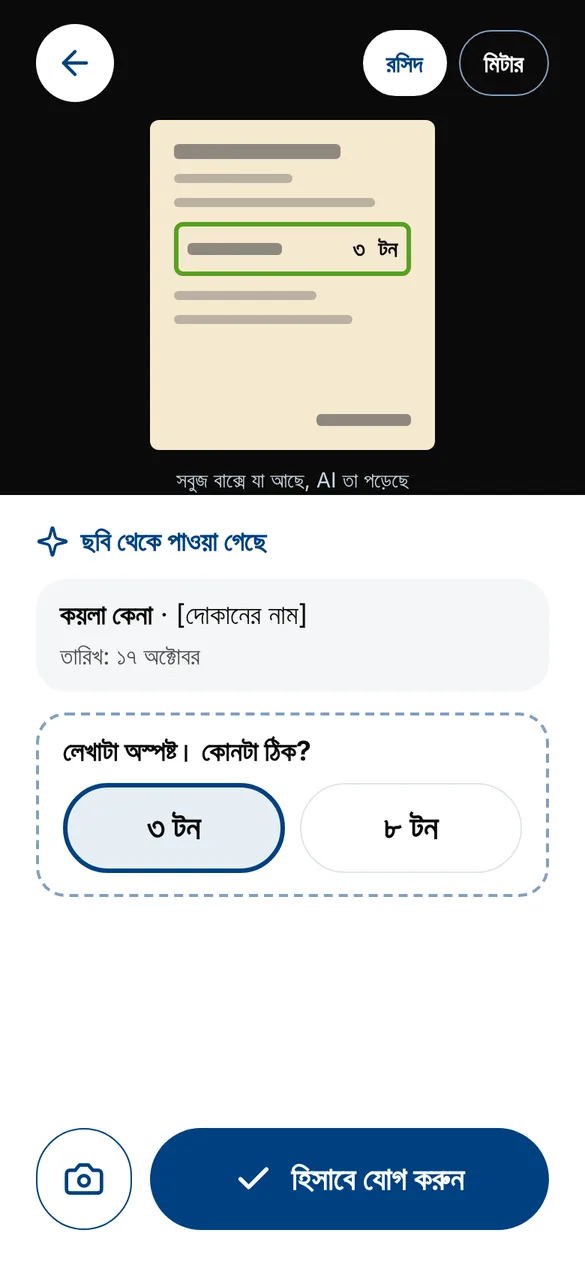
The worker photographs the coal receipt. The amount is hard to read, so the app asks a two-button question instead of making anyone type.
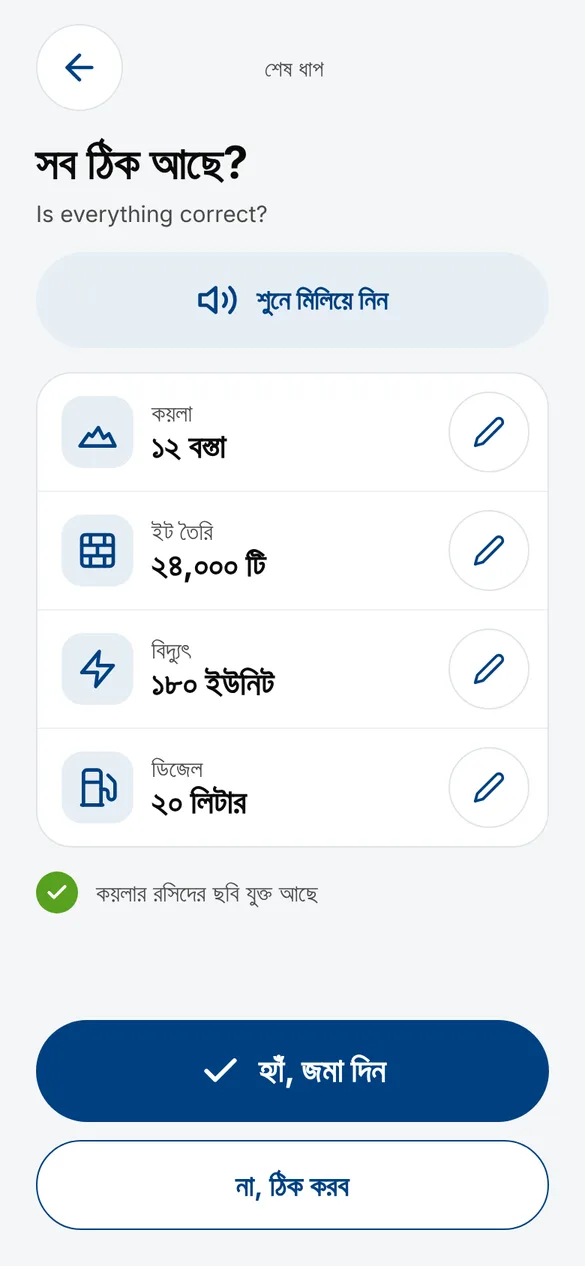
Everything for today in one list, with a pencil on each line. The worker taps the speaker to hear it read aloud, then confirms with one large button.
The screen says plainly that there is no internet right now and that the entry will send itself later. The worker doesn't need to do anything else.

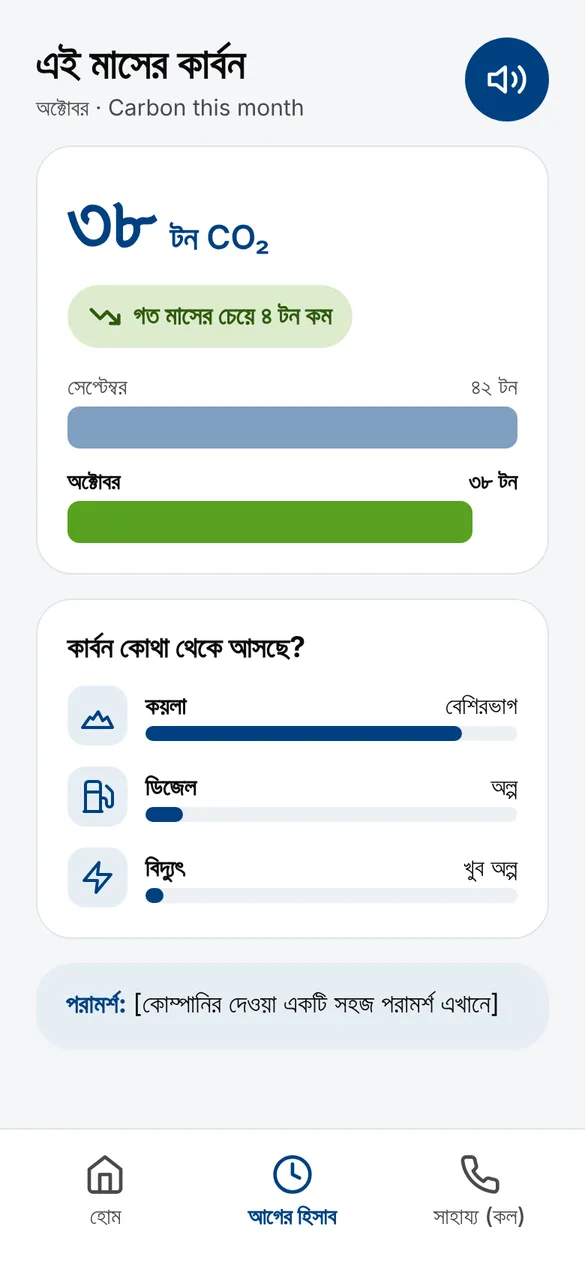
At any time the worker can see this month against last month, where most carbon comes from, and one tip from the company. The same data feeds the full GHG report for managers.
The calculation
The engine never changes per industry. Only the activity types, units and factors change, and those are configuration.
ECO₂e=Σ ( A×EFgas×GWPgas )
A activity data in base units (kg of coal, kWh, litres), after conversion from what the worker entered.
EF emission factor per gas, from a versioned factor library (for example IPCC defaults or a national grid factor).
GWP global warming potential that turns CH₄ and N₂O into CO₂e, from the IPCC assessment report the company reports against.
Worked path for one entry
Factors are stored with a version and source. When a factor is updated, past results stay reproducible and can be recalculated on purpose, never silently.
Industries and companies
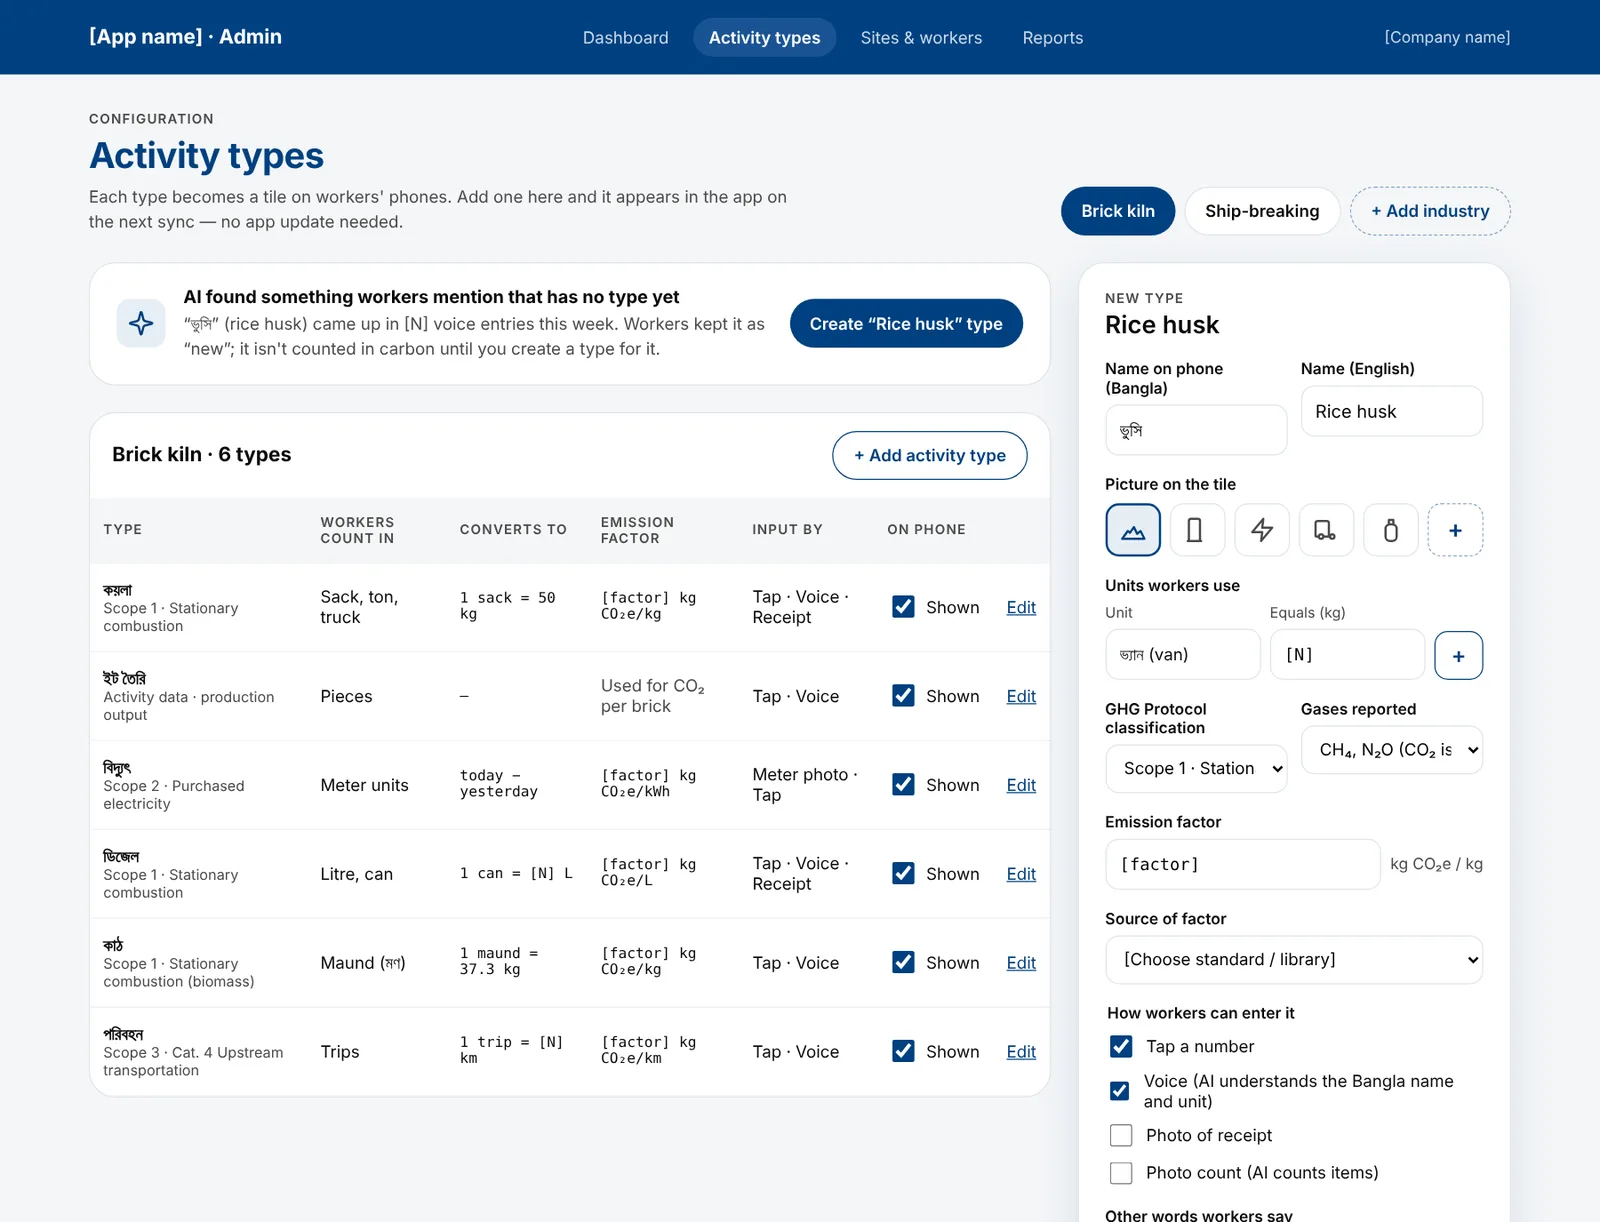
An industry is a template of activity types. Each company copies the template and adjusts it: its own sack weight, its own grid factor, extra types it needs. Garments can be added later the same way.
Seasonal: most emissions fall in the six dry-season firing months. Intensity is kg CO₂e per 1,000 bricks.
Tracked per ship. Intensity is kg CO₂e per tonne of steel recovered. Refrigerant release from dismantled systems is a key fugitive source.
Same engine, new template. Likely types: boiler fuel, grid and captive power, refrigerants, purchased fabric.
AI features
AI removes the need to read and write. It is used for understanding input and spotting problems, never for inventing data.
Bangla speech recognition plus item extraction. Understands local words and units, including the extra names admins add for each type.
Reads quantity, date and seller from fuel receipts, and digits from electricity meters. The photo is kept as evidence.
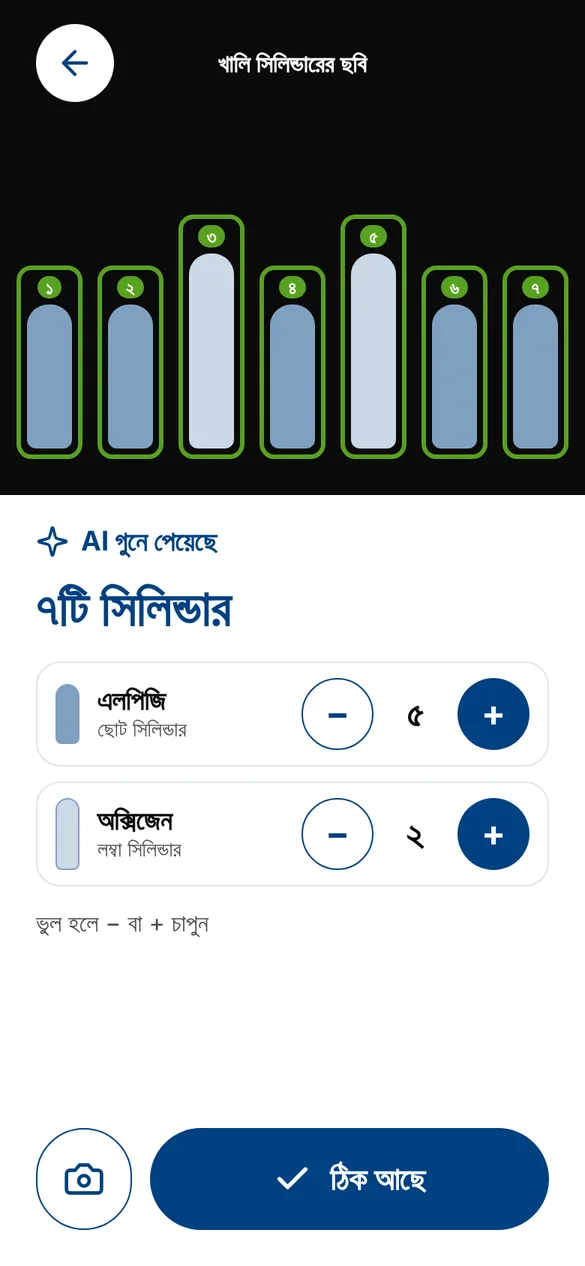
Counts gas cylinders and sorts them by type. The worker fixes the count with + and − if needed.
When workers keep mentioning something with no type (rice husk, say), the admin is offered a one-click new type.
Compares each entry with the site's history and season, and sends outliers to the admin with their evidence.
The rule: AI suggests, a person confirms. Every AI result is shown back and confirmed by the worker, every entry records how it was made (tap, voice, photo) and its confidence, and the report shows how much of the total is backed by evidence.
Designing for low literacy
Standards and classification
Every emission record carries its scope, source category, gas and factor version, so the same data produces either framework's report.
From sources the company owns or controls.
From purchased electricity, heat or steam.
In the value chain, from 15 standard categories. Most relevant here:
| Every record stores | Values | Why |
|---|---|---|
| Scope and source category | Scope 1–3 · stationary, mobile, process, fugitive · Scope 3 Cat. 1–15 | GHG Protocol Corporate and Scope 3 Standards |
| ISO 14064-1 category | 1 Direct · 2 Imported energy · 3 Transportation · 4 Products used · 5 Use of products · 6 Other | ISO 14064-1:2018 inventory and verification |
| Gas | CO₂ · CH₄ · N₂O · HFCs · PFCs · SF₆ · NF₃ | Gas-level reporting and GWP conversion |
| Biogenic flag | Biogenic CO₂ kept as a memo item outside the scopes | Required separate reporting for biomass |
| Factor version and source | Library, year, region, GWP set | Reproducible results and base-year recalculation |
| Evidence and method | Photo, voice clip, meter reading · tap / voice / photo · AI confidence | Audit trail for ISO 14064-3 verification |
Architecture
Each company's data is isolated. The calculation engine and factor library are shared and versioned.
Clients
Edge
Services
Data
Suggested rollout
We're looking for brick kilns and ship-breaking yards for Phase 1.
High-level design v0.1. Factor libraries, GWP set and targets to be confirmed before production.